Note
Go to the end to download the full example code.
Parametric study#
This example shows how to use PyAdditive to perform a parametric study.
You perform a parametric study if you want to optimize additive machine parameters
to achieve a specific result. This examples first uses the ParametricStudy
class to perform the parametric study. It then uses the display
package in PyAdditive-Widgets to visualize the results of the study.
Units are SI (m, kg, s, K) unless otherwise noted.
Perform required imports and create study#
Perform the required imports and create a ParametricStudy instance.
from ansys.additive.core import Additive, SimulationStatus, SimulationType
from ansys.additive.core.parametric_study import ColumnNames, ParametricStudy
import ansys.additive.core.parametric_study.display as display

study = ParametricStudy("demo-study")
Saving parametric study to /home/runner/work/pyadditive-widgets/pyadditive-widgets/examples/demo-study.ps
Get name of study file#
The current state of the parametric study is saved to a file upon each update. This code retrieves the name of the file. This file uses a binary format and is not human readable.
print(study.file_name)
/home/runner/work/pyadditive-widgets/pyadditive-widgets/examples/demo-study.ps
Select material for study#
Select a material to use in the study. The material name must be known by the Additive service. You can connect to the Additive service and print a list of available materials prior to selecting one.
additive = Additive()
print("Available material names: {}".format(additive.materials_list()))
material = "IN718"
user data path: /home/runner/.local/share/pyadditive
Available material names: ['Ti64', 'IN718', 'AlSi10Mg', 'Al357', '17-4PH', 'CoCr', 'IN625', '316L']
Create single bead evaluation#
Parametric studies often start with single bead simulations to determine melt
pool statistics. The following code uses the generate_single_bead_permutations()
method to generate single bead simulation permutations. This method’s parameters
allow you to specify a range of machine parameters and filter them by energy density.
Not all of the parameters listed are required. Optional parameters that are not specified
use the default values defined in the MachineConstants class.
import numpy as np

# Specify a range of laser powers. Valid values are 50 to 700 W.
initial_powers = np.linspace(50, 700, 7)
# Specify a range of laser scan speeds. Valid values are 0.35 to 2.5 m/s.
initial_scan_speeds = np.linspace(0.35, 2.5, 5)
# Specify powder layer thicknesses. Valid values are 10e-6 to 100e-6 m.
initial_layer_thicknesses = [40e-6, 50e-6]
# Specify laser beam diameters. Valid values are 20e-6 to 140e-6 m.
initial_beam_diameters = [80e-6]
# Specify heater temperatures. Valid values are 20 - 500 C.
initial_heater_temps = [80]
# Restrict the permutations within a range of energy densities
# For single bead, the energy density is laser power / (laser scan speed * layer thickness).
min_energy_density = 2e6
max_energy_density = 8e6
# Specify a bead length in meters.
bead_length = 0.001

study.generate_single_bead_permutations(
    material_name=material,
    bead_length=bead_length,
    laser_powers=initial_powers,
    scan_speeds=initial_scan_speeds,
    layer_thicknesses=initial_layer_thicknesses,
    beam_diameters=initial_beam_diameters,
    heater_temperatures=initial_heater_temps,
    min_area_energy_density=min_energy_density,
    max_area_energy_density=max_energy_density,
)
Show simulations as a table#
You can use the display
package to list the simulations as a table.
display.show_table(study)
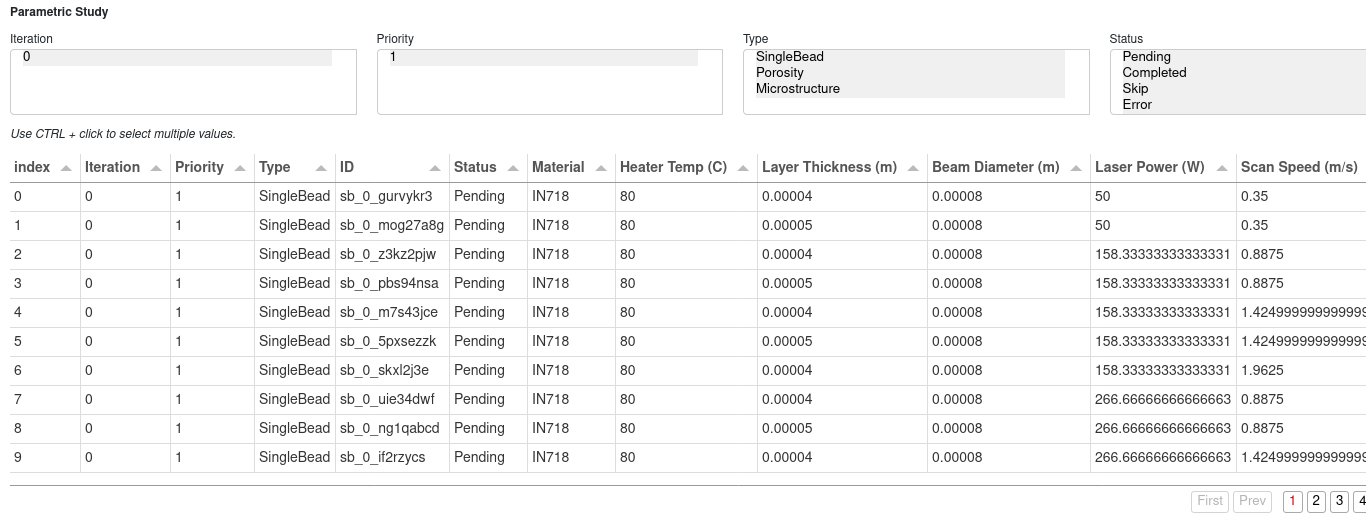
show_table
Skip some simulations#
If you are working with a large parametric study, you may want to skip some
simulations to reduce processing time. To do so, set the simulation status,
which is defined in the SimulationStatus class, to SimulationStatus.SKIP.
The following code obtains a DataFrame object, applies a filter
to get a list of simulation IDs, and then updates the status on the
simulations with those IDs.
df = study.data_frame()
# Get IDs for single bead simulations with laser power below 75 W.
ids = df.loc[
    (df[ColumnNames.LASER_POWER] < 75) & (df[ColumnNames.TYPE] == SimulationType.SINGLE_BEAD),
    ColumnNames.ID,
].tolist()
study.set_status(ids, SimulationStatus.SKIP)
display.show_table(study)

show_table
Run single bead simulations#
Run the simulations using the run_simulations() method. All simulations
with a SimulationStatus.PENDING status are executed.
study.run_simulations(additive)
2024-06-14 20:10:26 Completed 0 of 31 simulations
2024-06-14 20:10:48 Completed 1 of 31 simulations
2024-06-14 20:11:03 Completed 2 of 31 simulations
2024-06-14 20:11:17 Completed 3 of 31 simulations
2024-06-14 20:11:29 Completed 4 of 31 simulations
2024-06-14 20:11:44 Completed 5 of 31 simulations
2024-06-14 20:11:58 Completed 6 of 31 simulations
2024-06-14 20:12:11 Completed 7 of 31 simulations
2024-06-14 20:12:23 Completed 8 of 31 simulations
2024-06-14 20:12:38 Completed 9 of 31 simulations
2024-06-14 20:12:54 Completed 10 of 31 simulations
2024-06-14 20:13:11 Completed 11 of 31 simulations
2024-06-14 20:13:24 Completed 12 of 31 simulations
2024-06-14 20:13:36 Completed 13 of 31 simulations
2024-06-14 20:13:50 Completed 14 of 31 simulations
2024-06-14 20:14:03 Completed 15 of 31 simulations
2024-06-14 20:14:18 Completed 16 of 31 simulations
2024-06-14 20:14:34 Completed 17 of 31 simulations
2024-06-14 20:14:47 Completed 18 of 31 simulations
2024-06-14 20:14:59 Completed 19 of 31 simulations
2024-06-14 20:15:13 Completed 20 of 31 simulations
2024-06-14 20:15:28 Completed 21 of 31 simulations
2024-06-14 20:15:45 Completed 22 of 31 simulations
2024-06-14 20:16:01 Completed 23 of 31 simulations
2024-06-14 20:16:25 Completed 24 of 31 simulations
2024-06-14 20:16:48 Completed 25 of 31 simulations
2024-06-14 20:17:02 Completed 26 of 31 simulations
2024-06-14 20:17:19 Completed 27 of 31 simulations
2024-06-14 20:17:35 Completed 28 of 31 simulations
2024-06-14 20:17:59 Completed 29 of 31 simulations
2024-06-14 20:18:16 Completed 30 of 31 simulations
2024-06-14 20:18:29 Completed 31 of 31 simulations
Save study to CSV file#
The parametric study is saved with each update in a binary format.
For other formats, use the to_* methods provided by the DataFrame class.
study.data_frame().to_csv("demo-study.csv")
Plot single bead results#
Plot the single bead results using the
single_bead_eval_plot() function.
display.single_bead_eval_plot(study)
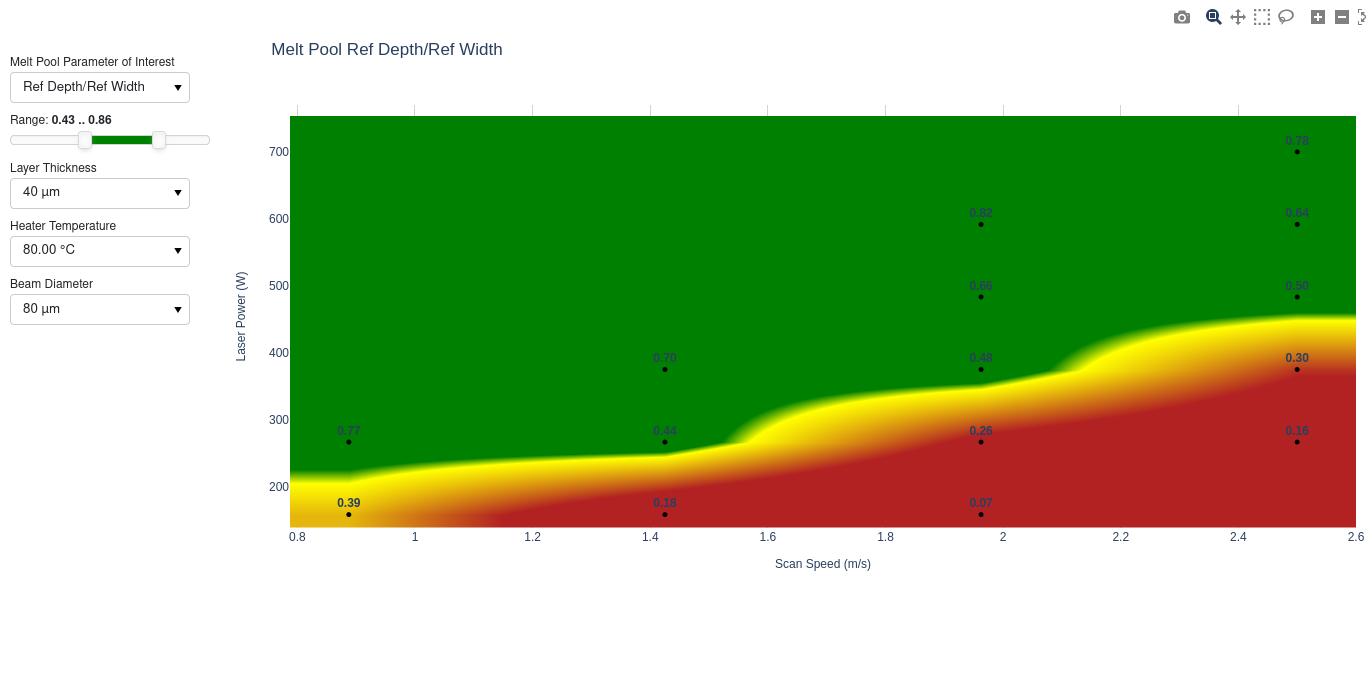
single_bead_eval_plot
Create porosity evaluation#
You can use the insights gained from the single bead evaluation to
generate parameters for a porosity evaluation. Alternatively, you can
perform a porosity evaluation without a previous single bead evaluation.
The following code determines the laser power and scan speeds by filtering the
single bead results, where the ratio of the melt pool reference depth
to reference width is within a specified range. Additionally, it restricts the
simulations to a minimum build rate, which is calculated as
scan speed * layer thickness * hatch spacing. Finally, it uses the
generate_porosity_permutations() method to add
porosity simulations to the study.
df = study.data_frame()
df = df[
    (df[ColumnNames.MELT_POOL_REFERENCE_DEPTH_OVER_WIDTH] >= 0.3)
    & (df[ColumnNames.MELT_POOL_REFERENCE_DEPTH_OVER_WIDTH] <= 0.65)
]

study.generate_porosity_permutations(
    material_name=material,
    laser_powers=df[ColumnNames.LASER_POWER].unique(),
    scan_speeds=df[ColumnNames.SCAN_SPEED].unique(),
    size_x=1e-3,
    size_y=1e-3,
    size_z=1e-3,
    layer_thicknesses=[40e-6],
    heater_temperatures=[80],
    beam_diameters=[80e-6],
    start_angles=[45],
    rotation_angles=[67.5],
    hatch_spacings=[100e-6],
    min_build_rate=5e-9,
    iteration=1,
)
Run porosity simulations#
Run the simulations using the run_simulations() method.
study.run_simulations(additive)
2024-06-14 20:18:32 Completed 0 of 15 simulations
2024-06-14 20:19:23 Completed 1 of 15 simulations
2024-06-14 20:20:02 Completed 2 of 15 simulations
2024-06-14 20:20:34 Completed 3 of 15 simulations
2024-06-14 20:21:31 Completed 4 of 15 simulations
2024-06-14 20:22:12 Completed 5 of 15 simulations
2024-06-14 20:22:47 Completed 6 of 15 simulations
2024-06-14 20:23:56 Completed 7 of 15 simulations
2024-06-14 20:24:41 Completed 8 of 15 simulations
2024-06-14 20:25:15 Completed 9 of 15 simulations
2024-06-14 20:27:20 Completed 10 of 15 simulations
2024-06-14 20:28:11 Completed 11 of 15 simulations
2024-06-14 20:28:48 Completed 12 of 15 simulations
2024-06-14 20:31:48 Completed 13 of 15 simulations
2024-06-14 20:33:01 Completed 14 of 15 simulations
2024-06-14 20:33:42 Completed 15 of 15 simulations
Plot porosity results#
Plot the porosity simulation results using the
porosity_contour_plot() method.
display.porosity_contour_plot(study)
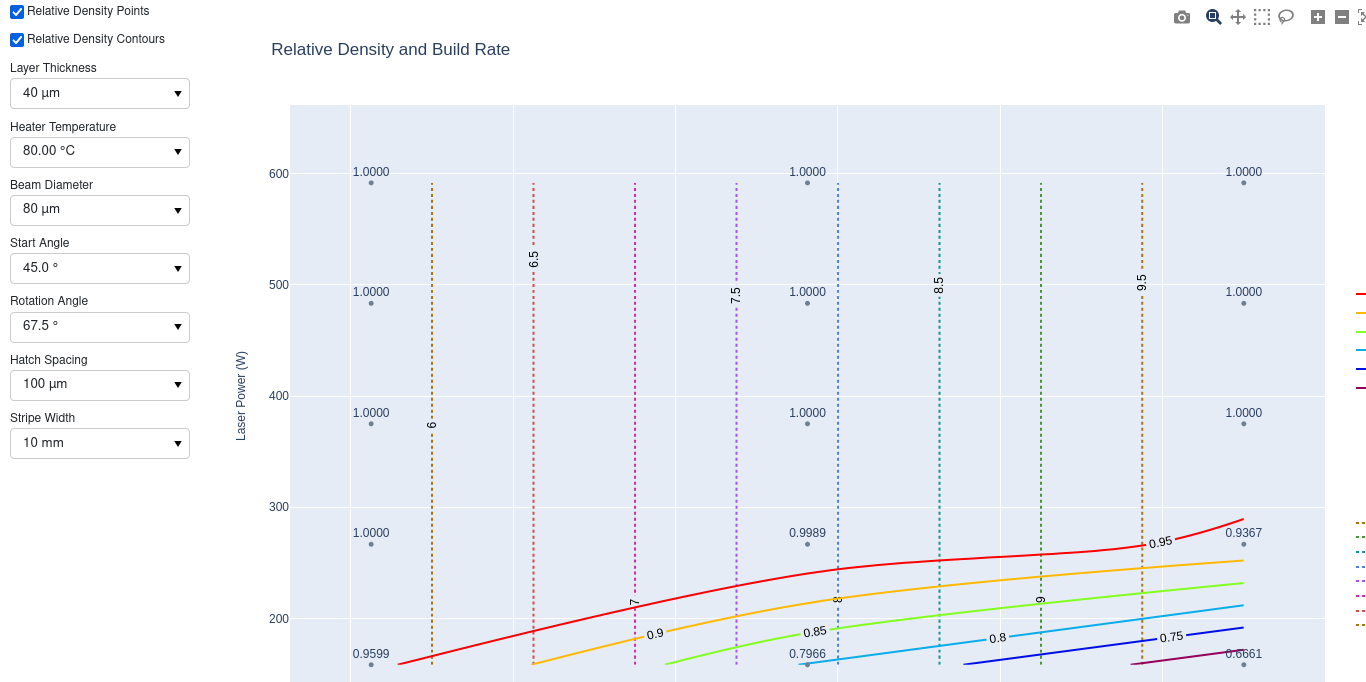
porosity_contour_plot
Create microstructure evaluation#
The following code generates a set of microstructure simulations using many of the same
parameters used for the porosity simulations. Because the cooling_rate,
thermal_gradient, melt_pool_width, and melt_pool_depth parameters are not
specified, they are calculated. The code then uses the
generate_microstructure_permutations() method to add
microstructure simulations to the study.
df = study.data_frame()
df = df[(df[ColumnNames.TYPE] == SimulationType.POROSITY)]

study.generate_microstructure_permutations(
    material_name=material,
    laser_powers=df[ColumnNames.LASER_POWER].unique(),
    scan_speeds=df[ColumnNames.SCAN_SPEED].unique(),
    size_x=1e-3,
    size_y=1e-3,
    size_z=1.1e-3,
    sensor_dimension=1e-4,
    layer_thicknesses=df[ColumnNames.LAYER_THICKNESS].unique(),
    heater_temperatures=df[ColumnNames.HEATER_TEMPERATURE].unique(),
    beam_diameters=df[ColumnNames.BEAM_DIAMETER].unique(),
    start_angles=df[ColumnNames.START_ANGLE].unique(),
    rotation_angles=df[ColumnNames.ROTATION_ANGLE].unique(),
    hatch_spacings=df[ColumnNames.HATCH_SPACING].unique(),
    iteration=2,
)
Run microstructure simulations#
Run the simulations using the run_simulations() method.
study.run_simulations(additive)
2024-06-14 20:33:44 Completed 0 of 15 simulations
2024-06-14 20:34:35 Completed 1 of 15 simulations
2024-06-14 20:35:15 Completed 2 of 15 simulations
2024-06-14 20:35:52 Completed 3 of 15 simulations
2024-06-14 20:36:43 Completed 4 of 15 simulations
2024-06-14 20:37:24 Completed 5 of 15 simulations
2024-06-14 20:38:00 Completed 6 of 15 simulations
2024-06-14 20:38:57 Completed 7 of 15 simulations
2024-06-14 20:39:39 Completed 8 of 15 simulations
2024-06-14 20:40:15 Completed 9 of 15 simulations
2024-06-14 20:41:37 Completed 10 of 15 simulations
2024-06-14 20:42:24 Completed 11 of 15 simulations
2024-06-14 20:43:02 Completed 12 of 15 simulations
2024-06-14 20:45:19 Completed 13 of 15 simulations
2024-06-14 20:46:18 Completed 14 of 15 simulations
2024-06-14 20:46:57 Completed 15 of 15 simulations
Plot microstructure results#
Plot and compare the average grain sizes from the microstructure simulations
using the ave_grain_size_plot()
function.
display.ave_grain_size_plot(study)
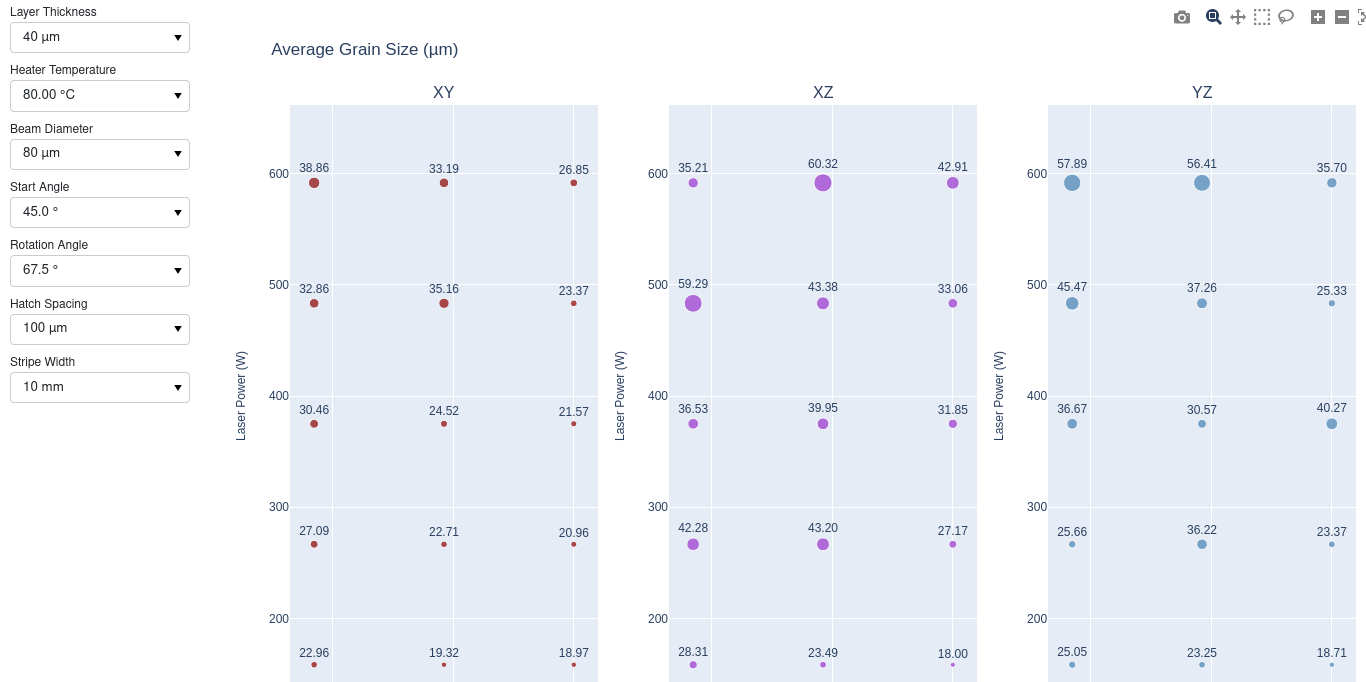
ave_grain_size_plot
Total running time of the script: (36 minutes 38.885 seconds)