Note
Go to the end to download the full example code.
Porosity evaluation plot#
This example shows how to use PyAdditive-Widgets to visualize the results
of a parametric study containing porosity simulations.
It uses the display package to
visualize the results of the study.
Units are SI (m, kg, s, K) unless otherwise noted.
Perform required imports and create study#
Perform the required imports and create a ParametricStudy instance.
from ansys.additive.core import Additive
from ansys.additive.core.parametric_study import ParametricStudy

from ansys.additive.widgets import display

study = ParametricStudy("porosity-study")
Saving parametric study to /home/runner/work/pyadditive-widgets/pyadditive-widgets/examples/porosity-study.ps
Get name of study file#
The current state of the parametric study is saved to a file on each update. This code retrieves the name of the file. This file uses a binary format and is not human readable.
print(study.file_name)
/home/runner/work/pyadditive-widgets/pyadditive-widgets/examples/porosity-study.ps
Select material for study#
Select a material to use in the study. The material name must be known by the Additive service. You can connect to the Additive service and print a list of available materials prior to selecting one.
additive = Additive()
additive.materials_list()
material = "IN718"
user data path: /home/runner/.local/share/pyadditive
Create porosity evaluation#
Generate a set of porosity simulations using the
generate_porosity_permutations() method.
This method’s parameters allow you to specify the material
and machine parameters for the simulations. Not all parameters
are required. Optional parameters that are not specified
use the default values defined in the MachineConstants class.
# Specify a range of laser powers. Valid values are 50 to 700 W.
laser_powers = [50, 150, 250, 350]
# Specify a range of laser scan speeds. Valid values are 0.35 to 2.5 m/s.
scan_speeds = [0.35, 0.5, 0.7]
# Specify a range of layer thicknesses. Valid values are 10-6 to 100e-6 m.
layer_thicknesses = [40e-6]
# Specify a range of heater temperatures. Valid values 20 - 500 C.
heater_temperatures = [80]
# Specify laser beam diameters. Valid values are 20e-6 to 140e-6 m.
beam_diameters = [80e-6]
# Specify the machine parameters for the simulations.
start_angles = [45]
rotation_angles = [67.5]
hatch_spacings = [100e-6]
stripe_widths = [0.05]

study.generate_porosity_permutations(
    material_name=material,
    laser_powers=laser_powers,
    scan_speeds=scan_speeds,
    size_x=1e-3,
    size_y=1e-3,
    size_z=1e-3,
    layer_thicknesses=layer_thicknesses,
    heater_temperatures=heater_temperatures,
    beam_diameters=beam_diameters,
    start_angles=start_angles,
    rotation_angles=rotation_angles,
    hatch_spacings=hatch_spacings,
    stripe_widths=stripe_widths,
    iteration=1,
)
Show simulations as a table#
Use the display
package to list the simulations as a table.
display.show_table(study)
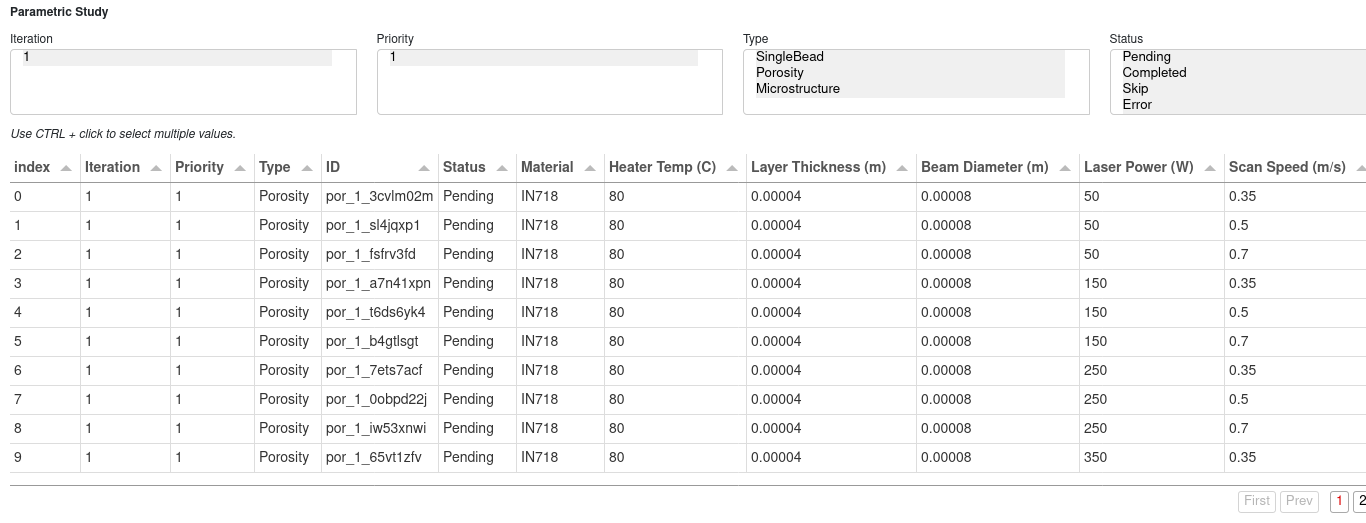
show_table
Run porosity simulations#
Run the simulations using the run_simulations() method.
study.run_simulations(additive)
2024-06-14 17:49:37 Completed 0 of 12 simulations
2024-06-14 17:52:29 Completed 1 of 12 simulations
2024-06-14 17:54:28 Completed 2 of 12 simulations
2024-06-14 17:55:57 Completed 3 of 12 simulations
2024-06-14 18:01:42 Completed 4 of 12 simulations
2024-06-14 18:04:33 Completed 5 of 12 simulations
2024-06-14 18:06:15 Completed 6 of 12 simulations
2024-06-14 18:31:08 Completed 7 of 12 simulations
2024-06-14 18:39:35 Completed 8 of 12 simulations
2024-06-14 18:42:46 Completed 9 of 12 simulations
2024-06-14 19:17:25 Completed 10 of 12 simulations
2024-06-14 19:37:36 Completed 11 of 12 simulations
2024-06-14 19:45:03 Completed 12 of 12 simulations
Plot porosity results#
Visualize porosity simulation results for relative density and build rate
as a contour plot using the porosity_contour_plot()
function.
display.porosity_contour_plot(study)
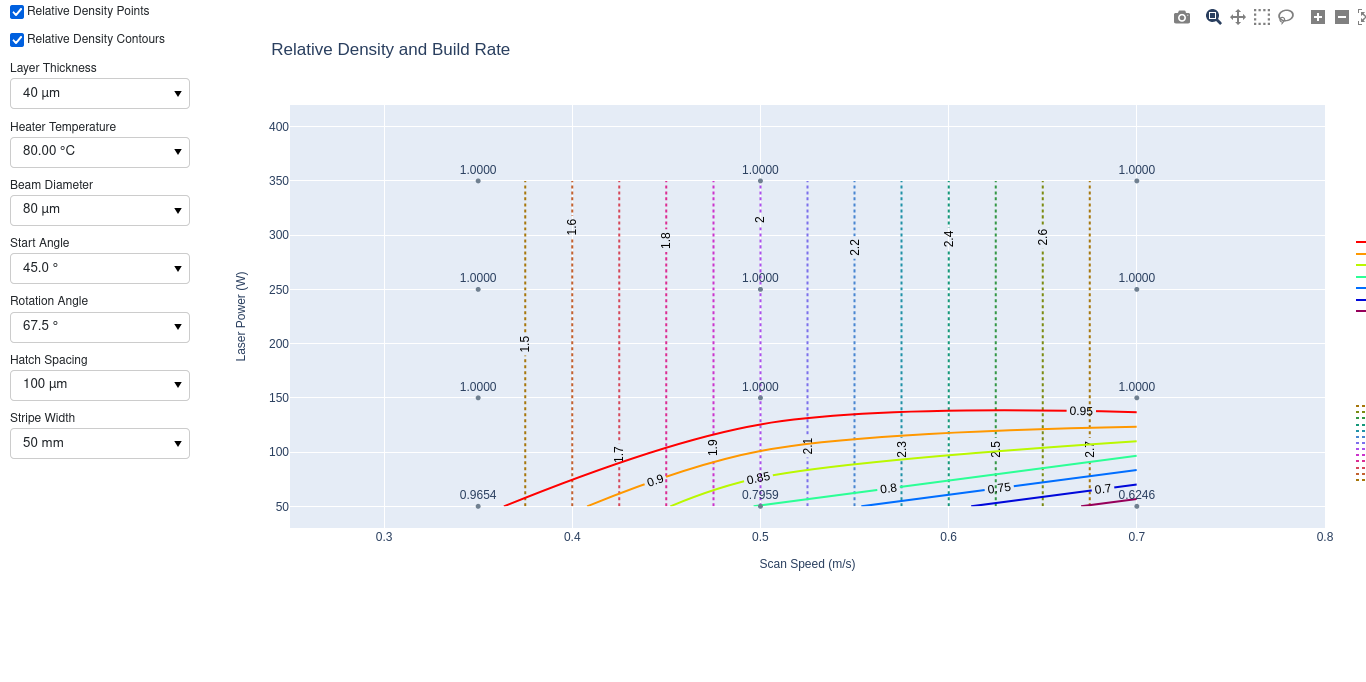
porosity_contour_plot
Visualize a heat map plot of porosity results to determine parametric regions
with desirable relative density statistics using the
porosity_eval_plot() function.
display.porosity_eval_plot(study)
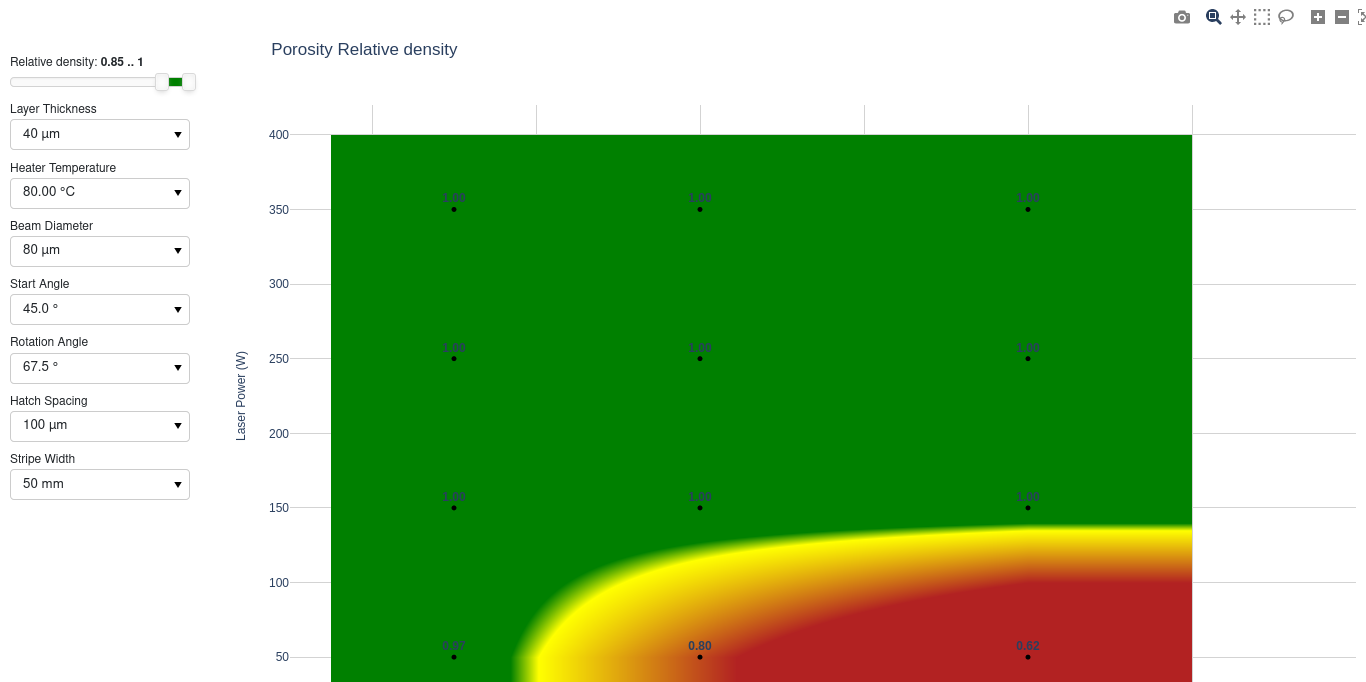
porosity_eval_plot
Total running time of the script: (115 minutes 32.139 seconds)